

US Debts in Center & Major Events This Week
The United States is facing a growing fiscal challenge as the cost of servicing its national debt escalates. Currently, the U.S. government pays an average interest rate of 3.289% on its $36.18 trillion debt, a significant figure when compared to its $29.18 trillion GDP. This means that every 1% increase in interest rates adds an additional $361.8 billion to the annual debt servicing cost.
Interest payments are no longer a minor expense, now competing with major government programs like defense and Medicare. In fiscal year 2024, interest costs reached 3.0% of GDP, nearing the modern-era peak of 3.2% seen in 1991. Projections from the Congressional Budget Office (CBO) indicate these costs could climb to 4.1% by 2035 under current laws. A more concerning scenario suggests that if average rates rise to 5.8% by 2054, the debt-to-GDP ratio could surge to 217%, significantly higher than the CBO’s baseline.
Should the 10-year Treasury yield consistently exceed 6%, annual interest payments could skyrocket to $2.1 trillion, approximately 7% of GDP. Most economists view crossing the 5% threshold for interest costs as a critical warning sign, potentially leading to a “debt spiral” where the government needs to borrow simply to cover its interest obligations, thereby crowding out other essential spending.
Historical context highlights the current risk. While the Federal Reserve aggressively raised rates in the 1980s to combat inflation, leading to 10-year yields above 10%, the national debt then was a manageable 30% of GDP. By the 1990s, with debt at 50% of GDP, rising interest costs prompted political action and budget discipline. The period from 2010 to 2021, characterized by record-low interest rates, created a false sense of security regarding the nation’s ability to borrow without significant repercussions. However, with the Federal Reserve now tightening monetary policy, the true cost of America’s debt is becoming increasingly apparent, and the pressure is mounting rapidly.
Domestically, the U.S. has some flexibility, as about 70% of its debt is held by American investors, including the Federal Reserve. While this provides stability, excessive reliance on domestic buyers could stifle private investment. Furthermore, if the Fed increases its Treasury purchases, it risks reigniting inflation and weakening the dollar, a strategy used during the COVID-19 pandemic but with potential long-term credibility issues if overused.
Continued increases in yields, particularly if the 10-year yield surpasses 5.5%, will put significant pressure on fiscal policy. Potential solutions from a future administration, such as spending freezes, tax adjustments, or even debt restructuring, are being considered. Strategies like extending debt maturities to lock in rates or using tariffs and capital repatriation for revenue are ideas, but they carry inherent risks and depend heavily on market confidence. While strong GDP growth could theoretically boost tax revenue and alleviate the issue, it alone may not suffice if interest rates remain elevated or inflation persists. Markets will demand concrete reform, not just optimistic projections.
The escalating debt situation directly impacts financial markets. Rising yields make stocks less attractive by increasing the discount rate applied to future earnings. If interest costs exceed 5% of GDP, risk assets could experience substantial pullbacks, and equity valuations, especially in growth sectors reliant on cheap capital, will need to adjust to this new rate environment. For the U.S. dollar, it’s a delicate balance; while higher yields can attract short-term capital, concerns about debt sustainability could reverse these flows, potentially leading to a weaker dollar, higher import prices, and increased inflation – outcomes the Fed aims to avoid.
In essence, while the U.S. can still finance its debt, the margin for doing so without significant consequences is narrowing. Fiscal responsibility has transitioned from a long-term theoretical discussion to an immediate market driver. With crucial core inflation and GDP data expected this week, markets are poised to test the implications of this evolving fiscal landscape.
US Index
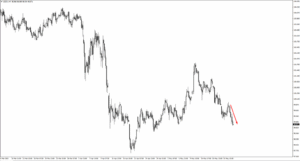
The US Dollar Index (USDX) has continued its pullback from the 100.15 supply zone, a level that previously acted as resistance. The index is now testing the 98.30 support level. This test is crucial given the dollar’s mixed drivers of yield attractiveness and underlying structural concerns. A hold above 98.30 could lead to a technical rebound, while a break lower would open the door for a deeper correction, especially if bond yields decline or inflation data comes in weaker than expected.
EUR/USD:
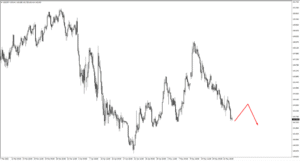
The EUR/USD pair has experienced a clean rally from the 1.1240 key support area. Attention now shifts to the 1.1470 resistance level. The pair maintains a cautiously bullish momentum, supported by expectations of a weaker dollar. However, further upside confirmation will likely depend on Thursday’s U.S. GDP report and Friday’s Core PCE inflation data. A softer economic print could solidify the recent breakout, whereas stronger-than-expected data might introduce volatility.
GBP/USD:
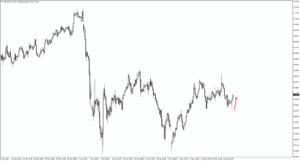
The GBP/USD has extended its bullish run this week, with focus now on potential resistance levels at 1.3595 and 1.3670. Given the pair’s sensitivity to interest rate guidance, traders should closely monitor Friday’s speech by Bank of England Governor Bailey for potential technical reactions. Caution is advised for signs of a bearish reversal near these resistance zones, particularly if the dollar finds temporary strength or if there’s a shift in the outlook for UK inflation.
USD/JPY:
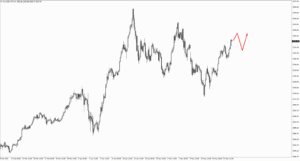
The USD/JPY pair is currently in a consolidation phase, nearing resistance levels at 143.30 and 143.80. These levels are critical decision points. If the price approaches them slowly and forms bearish reversal patterns (like a bearish engulfing or evening star), it could signal short-selling opportunities. However, if the move towards resistance is strong and driven by rising U.S. bond yields, sellers should exercise patience and await clearer signals.
USD/CHF:
USD/CHF has recently drifted lower but held above the 0.8330 support level. As it now retraces upward, resistance is anticipated at 0.8255 and 0.8280. These levels could present opportunities for bearish continuation trades if the price shows signs of stalling. The quality of these setups will depend on the strength of the upward impulse; a strong move into resistance might diminish the effectiveness of “fade” strategies (trading against the immediate momentum).
AUD/USD:
The AUD/USD is trading near its monthly highs, propelled by increased commodity demand and a generally softer U.S. dollar. If the pair consolidates at these elevated levels, the 0.6460 zone will be key for new bullish price action setups. Bulls would ideally want to see a controlled pullback to this region, followed by clear confirmation of renewed upward momentum before re-entering long positions.
NZD/USD:
NZD/USD has broken out of its recent trading range. If it enters a consolidation phase, the 0.5950 level will be a crucial point to watch for bullish price action signals. The upcoming Reserve Bank of New Zealand (RBNZ) cash rate decision later this week is expected to introduce volatility. Traders should be cautious before this announcement, especially if the pair aggressively pushes into resistance without prior consolidation.
USD/CAD:
The USD/CAD pair recently slipped just below the 1.3920 resistance zone. If the pair attempts a higher retracement in the near term, the 1.3810 area is identified as a potential zone for bearish setups. The Canadian dollar’s sensitivity to oil price movements means that crude oil dynamics will continue to be a significant factor influencing this pair’s direction.
USOil has exhibited an impulsive rally from the 60.20 level. The current market structure suggests potential for continued upside momentum, contingent on a clean, impulsive breach of the 64.534 resistance. Conversely, if price begins to consolidate at or below this resistance, it may signal a loss of upward conviction and could precede a deeper retracement
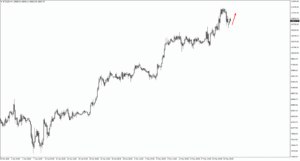
Gold continued its ascent this week, pushing past the 3220 level. Traders are now focusing on the 3400 resistance zone. If the price retreats from 3400, the 3305 area could become a key support for bulls to re-enter, provided there’s clear bullish price action, especially in response to Friday’s inflation data
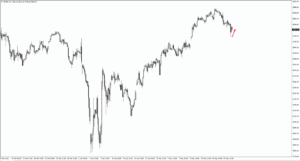
The S&P 500 continues its recovery, advancing from the 5740 area. A pullback to 5690 would be a key level to watch for new bullish opportunities. A strong push higher could see the index target 6100. However, persistent headwinds from rising Treasury yields and policy uncertainty may limit sustained gains, requiring traders to remain agile
Bitcoin (BTC):
Bitcoin continues to trade at elevated levels. Should the price extend its upward trajectory, key resistance zones at 113,500 and 123,000 will be crucial to monitor. While institutional demand and a general “risk-on” sentiment persist, the cryptocurrency market has become somewhat overheated. Chasing new highs without strong confirmation carries inherent risks in the current environment.
Macroeconomic Influences and Market Volatility:
The coming week is expected to provide further clarity and potentially inject renewed volatility into markets. Key U.S. economic data, including GDP and inflation figures, alongside central bank communications from both the Reserve Bank of New Zealand (RBNZ) and the Bank of England (BOE), will be closely watched.
Despite the technically sound structure observed in most assets, significant macroeconomic crosswinds remain active. Traders are advised to exercise caution when dealing with consolidation zones and to avoid assuming directional conviction until key price levels are clearly tested and confirmed by clean price action.